Data Types
Data types included by default with MxLIVE are MX Screening, MX Dataset, XRD Dataset, Rastering, XAS Dataset, XRF Dataset, and MAD Scan.
Creating New Data Types
Creating a new data type requires creating the Data Type, and adjusting the HTML template used for data viewing if necessary.
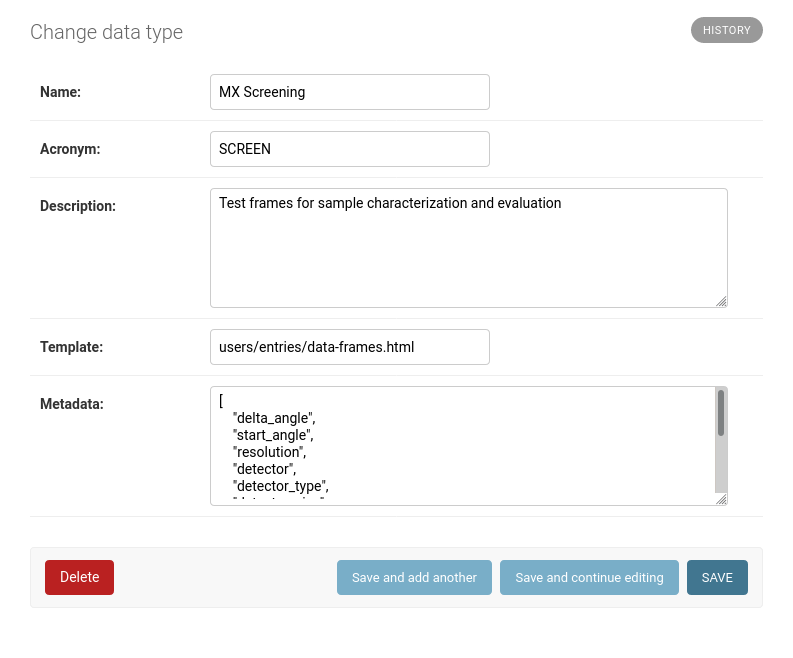
Go to the Django administration site and create a new Data Type. The Name and Description are used for display,
Acronym is the type referenced when uploading new datasets from the beamline,
Template is the HTML template file in the MxLIVE project that should be used to display datasets of this data type,
and Metadata is a list of fields that are expected to be uploaded along with new datasets of this data type.
Templates already exist for diffraction data (users/entries/data-frames.html), MAD scans (users/entries/data-mad.html), and XRF Scans (users/entries/data-xrf.html). MAD scans and XRF scans present data that is fetched from the data proxy, including data in .xdi files. If an existing template is sufficient for displaying the new kind of data, you can stop here.
Creating an HTML Template
For consistency, template files for new data types should be placed in mxlive/lims/templates/users/entries/, and can
be referenced by the file path under templates/. At a minimum, the template should extend users/entries/data.html,
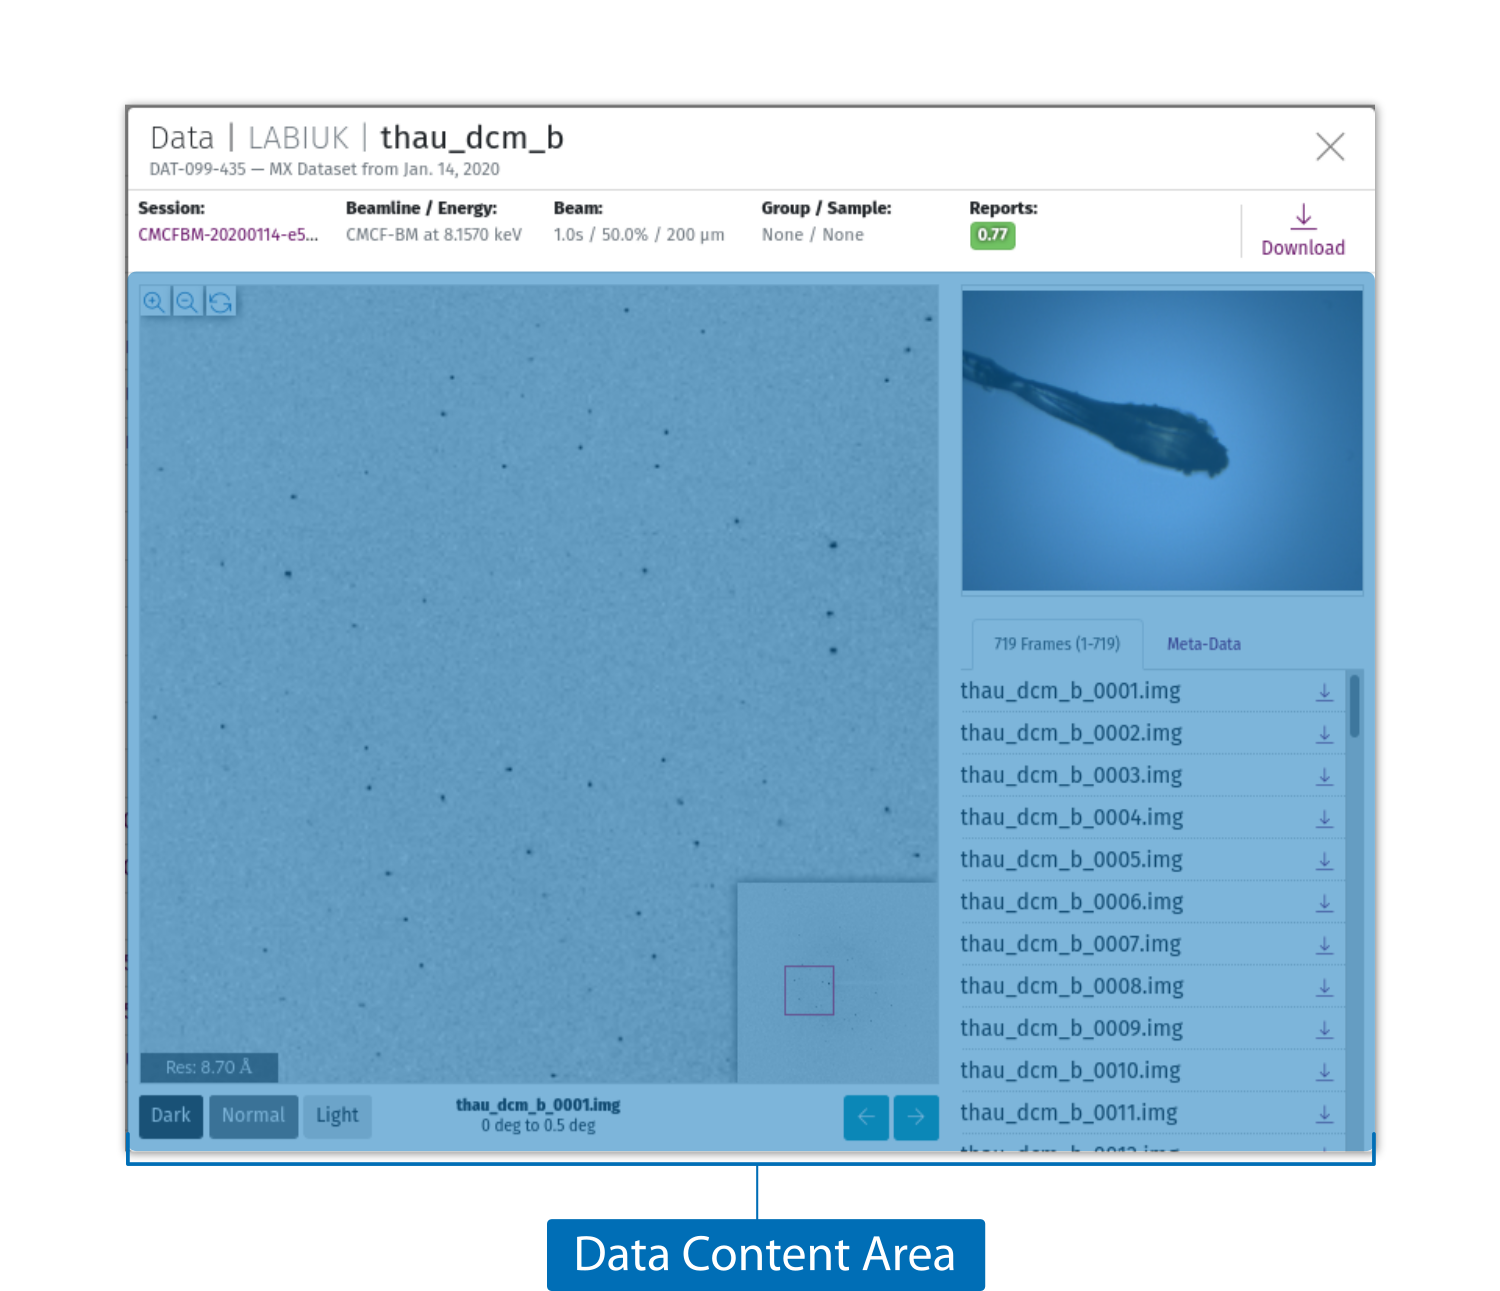
and define a data_content block.
{% extends "users/entries/data.html" %}

{% block data_content %}{% endblock %}      # Main area for data viewing
Using the Report Format
To use the MxLIVE report format, include the following assets in the modal_assets block:
{% load static %}

{% block modal_assets %}
    <link href="{% static "css/c3.min.css" %}" rel="stylesheet">
    <link href="{% static "css/reports.min.css" %}" rel="stylesheet">
    <script type="text/javascript" src="{% static "js/d3/d3.v5.min.js" %}"></script>
    <script type="text/javascript" src="{% static "js/d3/d3.legend.js" %}"></script>
    <script type="text/javascript" src="{% static 'js/d3/d3.timeline.min.js' %}"></script>
    <script type="text/javascript" src="{% static "js/misc/showdown.min.js" %}"></script>
    <script type="text/javascript" src="{% static "js/misc/c3.min.js" %}"></script>
    <script type="text/javascript" src="{% static "js/mxlive-reports.v2.min.js" %}"></script>
{% endblock %}
To create a custom report to display data, you will also need to define a custom tag in templatetags/data_server.py to
add your formatted report to the context, in which you may need to request files from the data proxy to get all the
information needed to build the report. Helper functions already exist for fetching JSON or XDI data (get_json_info
and get_xdi_info).
@register.simple_tag(takes_context=True)
def sample_report(context):
    data = context['data']
    ...
    report = {'details': [
        {
            'title': '',
            'content': [
                {
                    ...
                },
            ]
        },
    ]}

    return { 'report': report }
Load your custom tag into the template, and call it:
{% load data_server %}

{% block data_content %}
    {% sample_report as sample %}
{% endblock %}
Add an empty element with an id, assign your report to a javascript variable, and initialize the report in the
modal_scripts block:
{% load data_server %}
{% load jsutils %}

{% block data_content %}
    {% sample_report as sample %}
    <div class="row">
        <div class="col-12 pr-0">
            <div id="data-display" class="w-100 p-0"></div>
            <script>
                var report{{ data.pk }}={{ sample.report | jsonify }};
            </script>
        </div>
    </div>
{% endblock %}

{% block modal_scripts %}
    <script type="text/javascript">
        $('#modal').on('shown.bs.modal', function () {
            $('#data-display').liveReport({
                data: report{{ data.pk }}
            });
        });
    </script>
{% endblock %}